Say hello to the Overview: a brand-new landing page you can arrange yourself, built from widgets that show the numbers, maps and tasks that matter to your company.
Your new home page
The Overview lives where the dashboard used to be. Sign in and it is the first thing you see; the Flowplan logo and the Overview entry in the menu both bring you back to it. Old bookmarks to the dashboard address redirect automatically, so nothing you saved breaks.
Always fresh
The board refreshes itself every 2 minutes, so the numbers you see are never stale. The small status in the header tells you when they were last updated, and the refresh button fetches everything again on demand.
Widgets: the building blocks
Everything on the Overview is a widget. Each one answers a single question, and most of them can be clicked to open the details behind the number.
What kinds are there?
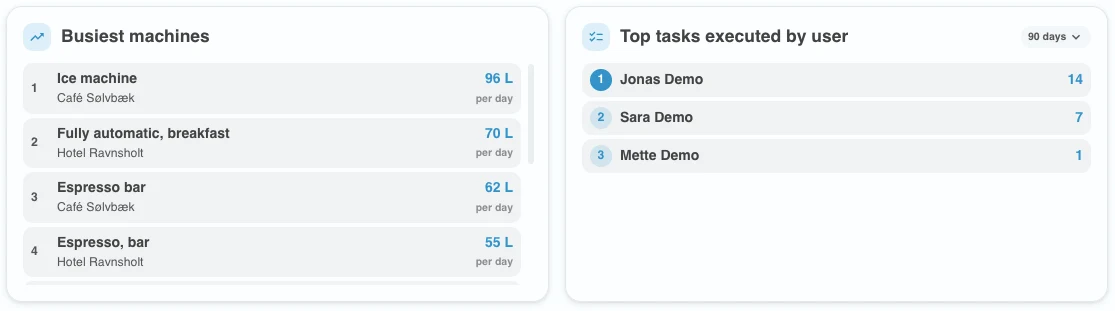
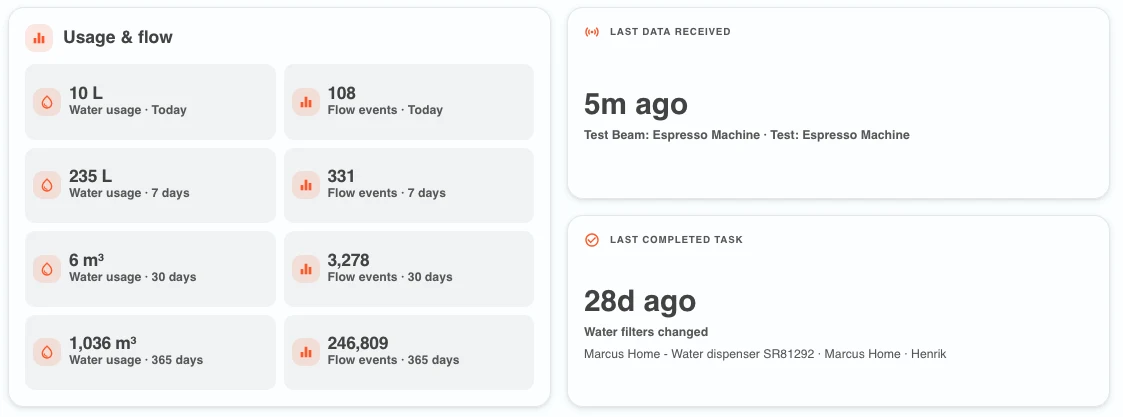
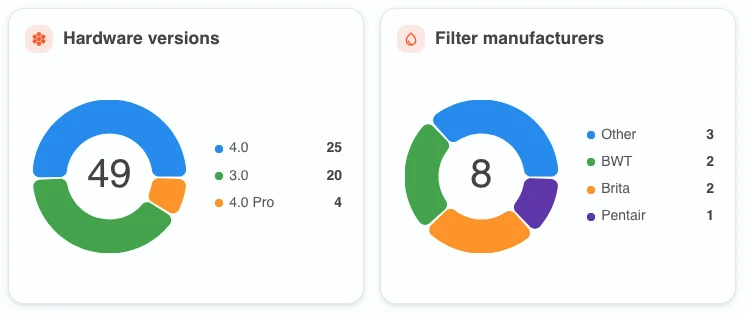
Stat tiles for single numbers such as overdue installations or filters changed in the last 30 days. Donut charts for task and connection status. Bar charts for usage per month and filter changes over time. Lists such as top technicians, busiest machines and installations needing attention. Billing status tiles for your beams. Maps, a calendar with agenda, and the packing list of what to bring on upcoming visits.
Click a number to see what is behind it
Overdue, due this week, due this month, leaks and maintenance all open a filtered list of the exact installations they count. What you see in the tile is what you get in the list, with export and send-to-technician available from there. The "Water filters changed" tile is the exception: it opens the activity view described further down.
Installations needing attention
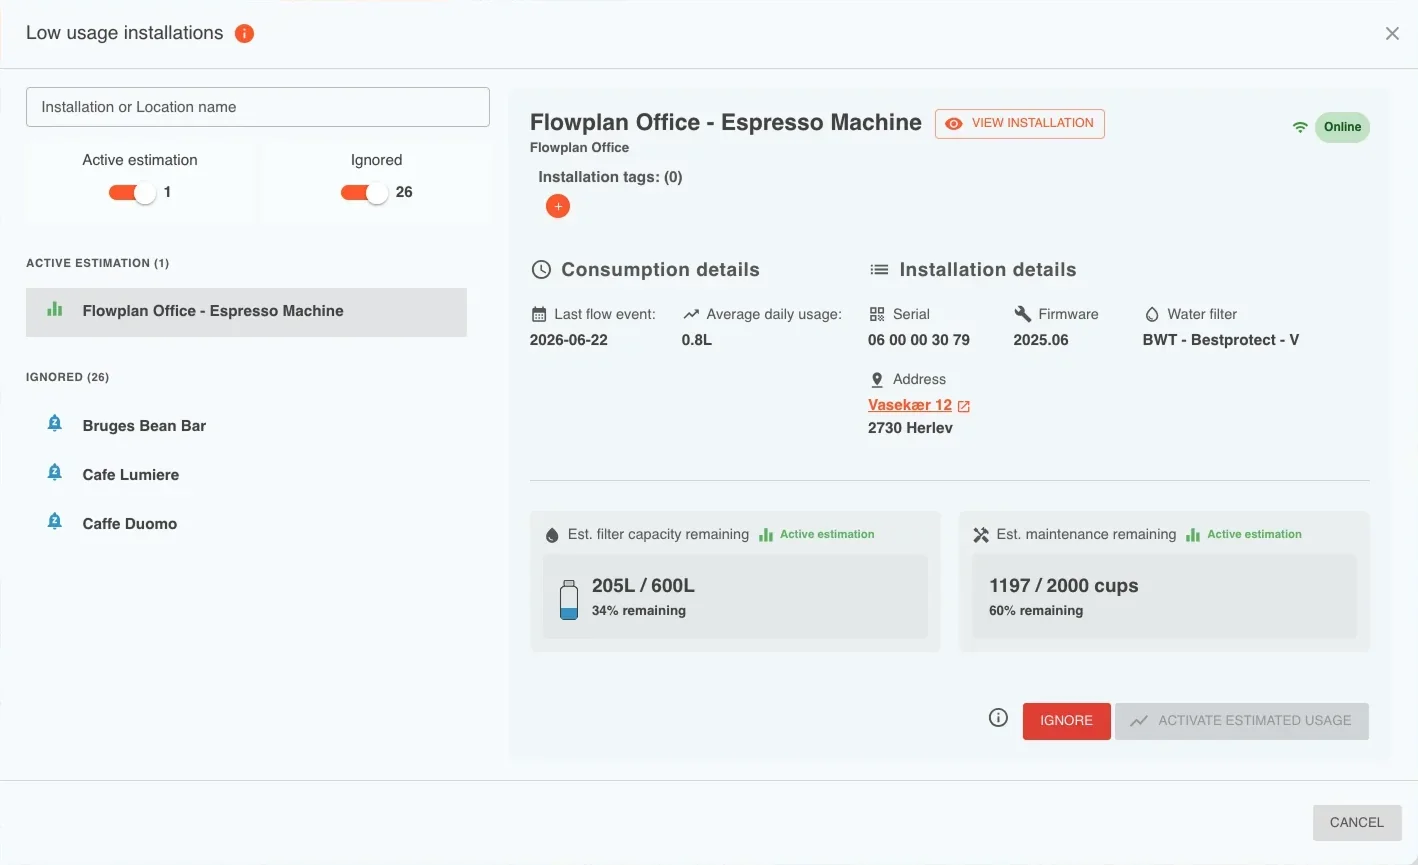
The attention widget lists the installations with overdue or upcoming filter changes and services. Two small flags next to a name tell you when the beam is offline or has not measured any water, the same icons you know from the installations list. "Show all" opens the full grid with export.
Compact or comfortable text

List and donut widgets have a text size switch in their header while you are editing. Pick compact to fit more on screen, or comfortable for easier reading on a wall monitor.
Who did what, and when
The top-by-user widgets rank your people by the water filters, maintenance jobs or batteries they changed. Each has a time window in its header: today, yesterday, this week, or the last 7, 30 or 90 days. The description and the trend arrow follow the window, comparing today with yesterday, yesterday with the day before, or a period with the period before it.
Click a name for the full picture
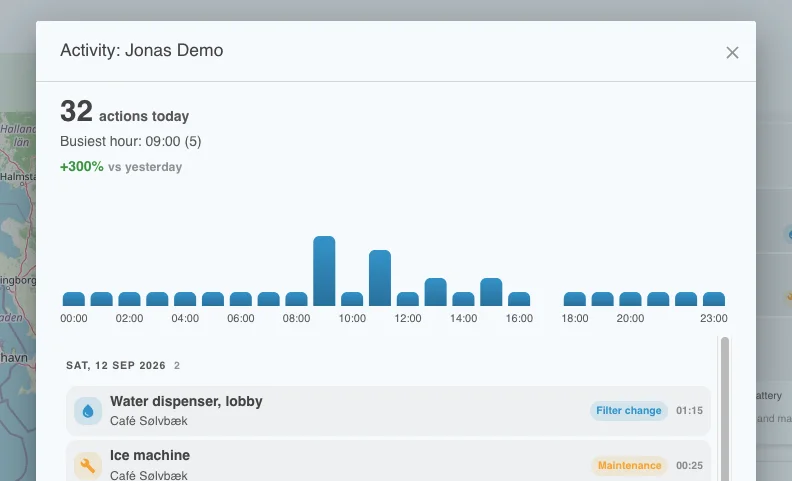
Clicking a row opens that person's activity. Short windows show a bar per hour, longer ones a bar per day, and the longest a heatmap of the whole period. Click a bar to jump to the tasks done in that hour or day. Battery changes show the exact time.
The company as a whole
The "Water filters changed" tile opens the same view for the entire company, so you can see when the work gets done, which days are busiest and how this period compares with the last.
One tag filter for the whole page
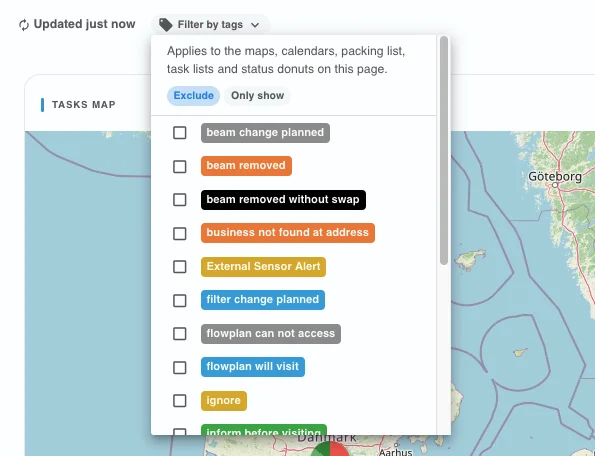
The tag filter from the old dashboard map is back, and it grew. It now sits in the Overview header and applies to the whole page at once: pick the tags to show, or the tags to hide, and every map, calendar, packing list, task list and status donut on the board follows. Widgets that count the whole company, such as filter changes over time, are marked "Not affected by the tag filter" so you always know what a number covers.
Only show, or exclude
The chip in the header shows how many tags are selected and whether they are shown or hidden. Switch between "Only show" and "Exclude" in the same menu, and clear the filter with one click. Your choice is remembered, so the board opens the way you left it.
Edit mode: build your own board
Administrators can shape the Overview for the whole company. Click the pencil icon in the header, or press and hold a widget header, and the board becomes a grid you can rearrange.

How it works
- 1. Click the pencil icon in the header, or press and hold a widget header. Widgets show a drag handle and a remove button.

- 2. Drag a widget by its handle to move it. Drag the corner to resize it. Widgets grow to fit their content, so text is never cut off.
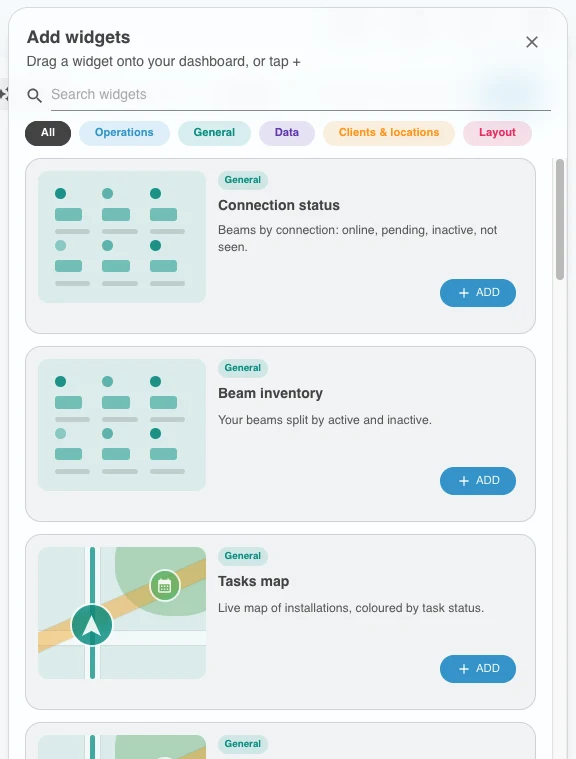
- 3. Open the widget drawer with "Add widgets", search or filter by group, then drag a widget onto the board or press Add.
- 4. Use "Auto-fit" to make the widgets fill the screen, or "Clear all" to start from an empty board.
- 5. Click "Done", or simply click an empty spot on the board, to leave edit mode. Changes save automatically and everyone in your company sees the same board.
Nothing is permanent
Removing a widget or clearing the board shows an undo button, and the reset action restores the layout you had when you started editing.
The widget drawer
"Add widgets" opens the drawer on the right. Search by name or filter by group: Operations, General, Data, Clients & locations and Layout. Each card shows a small sketch of the widget so you know what you are adding before it lands on the board. Most widgets are included for everyone; a few advanced ones show the plan they need.
Layout widgets: titles and spacers
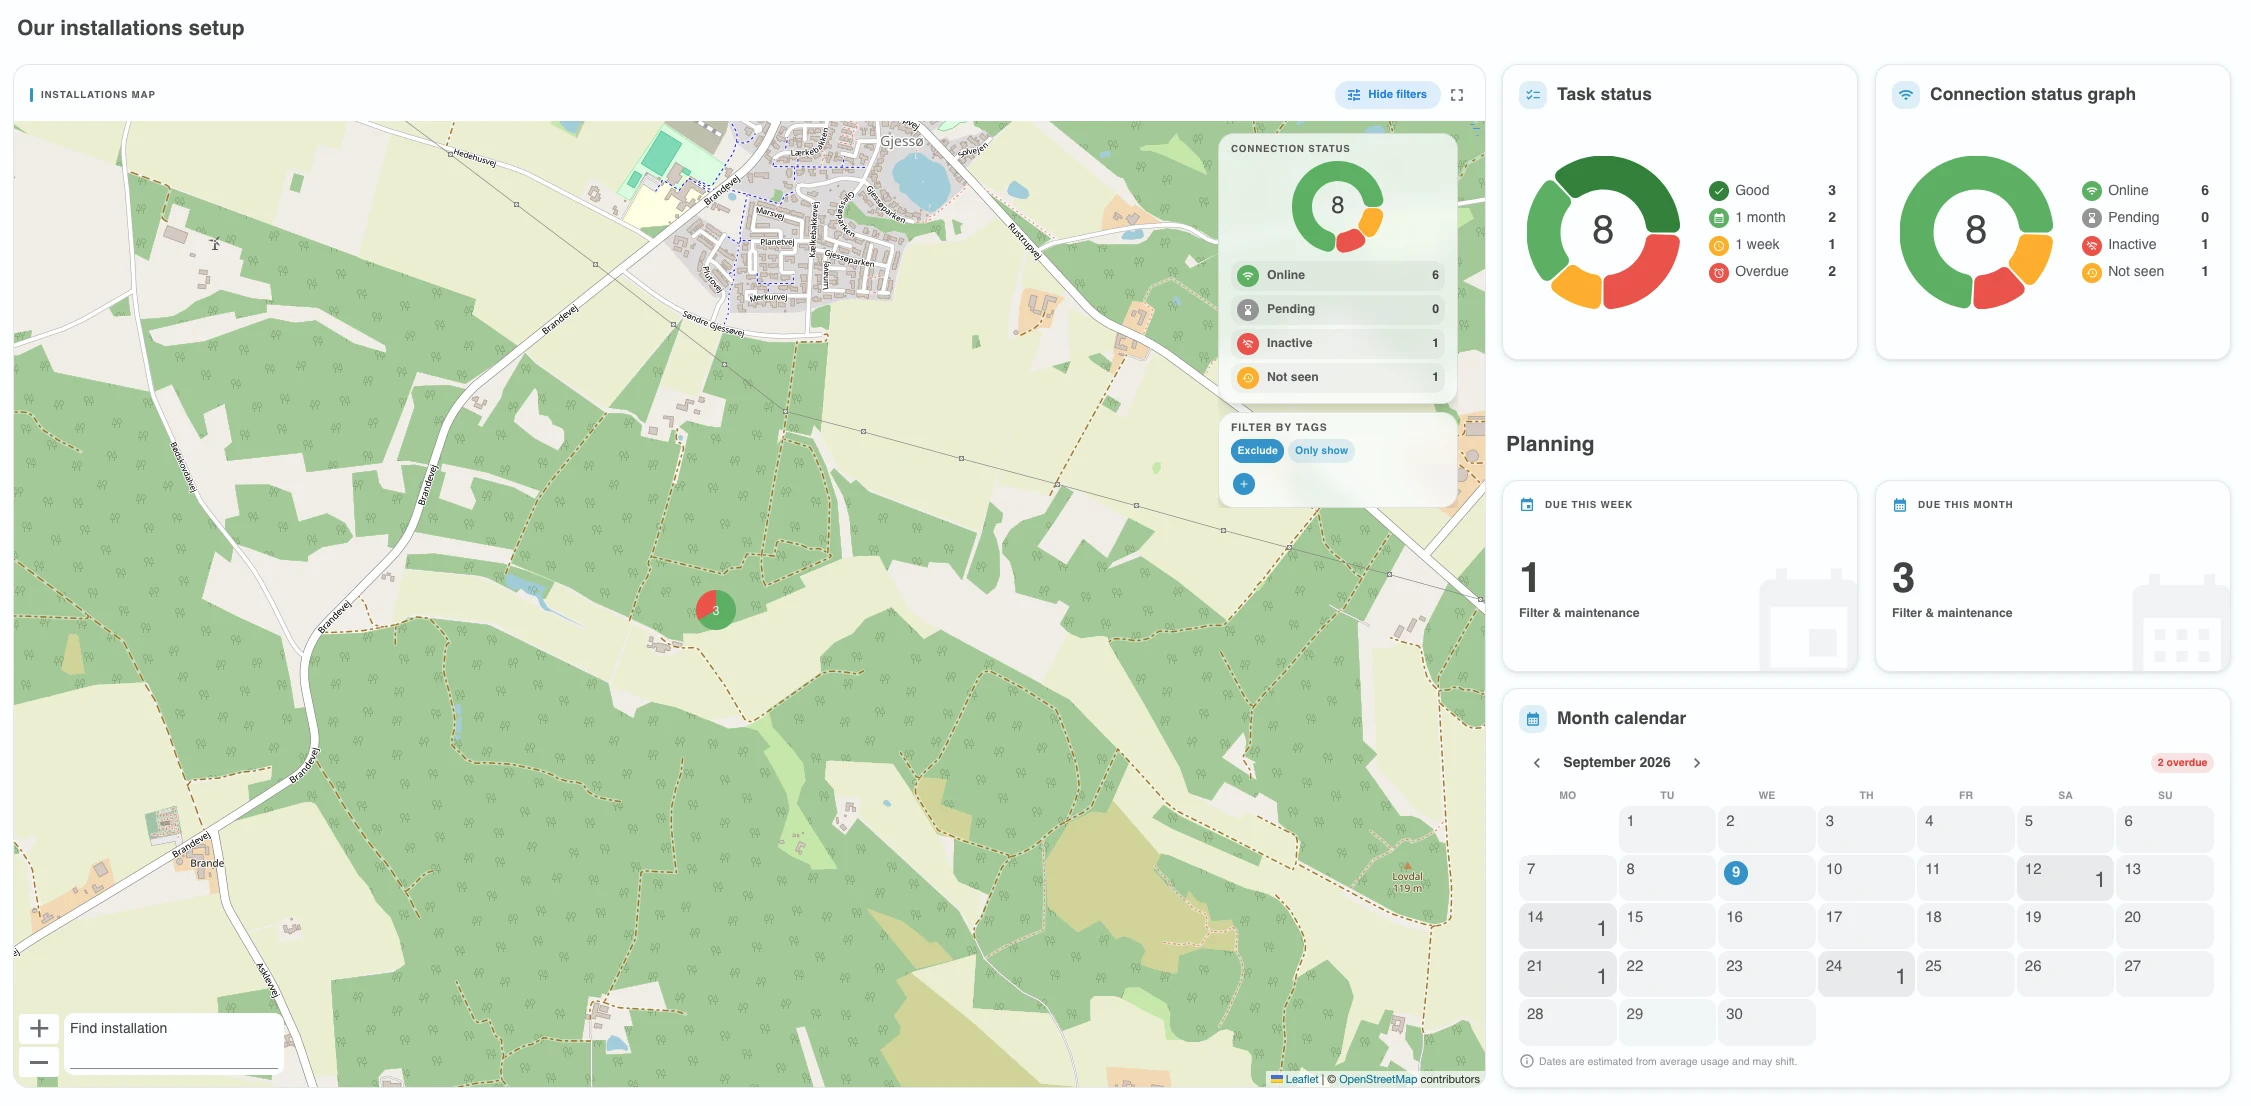
Two widgets carry no data at all. The title widget is a heading you type yourself, and the spacer is blank space with an optional divider line. Use them to split your board into sections such as "Our installations" and "Planning", so even a big board reads at a glance.
Presets: a good start in one click
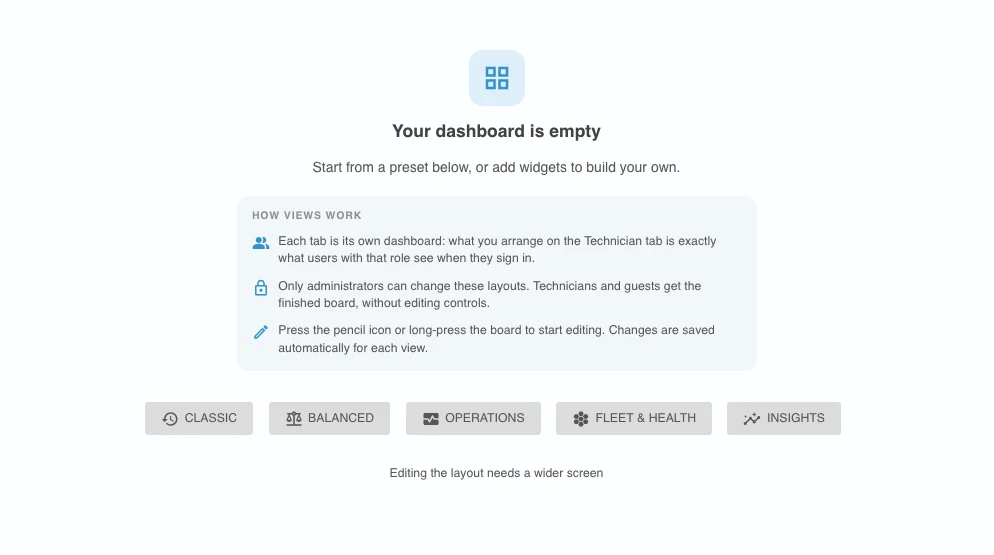
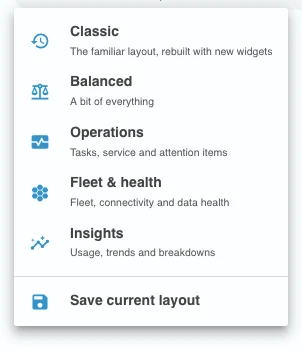
Not sure where to begin? Open the presets menu in the header and pick a ready-made layout. Each preset only places widgets that your subscription unlocks.
Classic: the old dashboard, rebuilt
If you liked the old dashboard, choose Classic. It brings back the pieces you used most: the installations map on the left, and the status donuts, the low usage and overdue tiles, the due-this-week and due-this-month tiles and a month calendar on the right. Familiar content, arranged as widgets you can now move around.
Balanced, Operations, Fleet & health, Insights, and two for technicians
Classic is what every company starts with, on the Admins tab and on the Technicians tab alike. Admins can also pick Balanced, a bit of everything; Operations for tasks, service and attention items; Fleet & health for connectivity and data health; and Insights for usage, trends and breakdowns. The Technicians tab has two of its own: Tasks & schedule puts the map, the calendar and the packing list front and centre, and Fleet status shows connectivity and device health at a glance.
Save your own
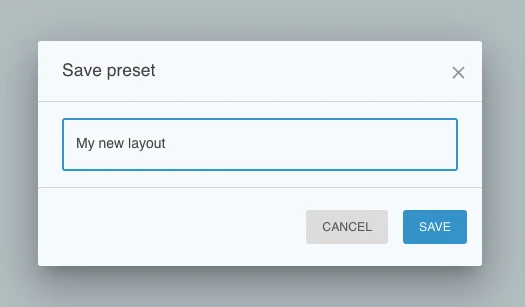
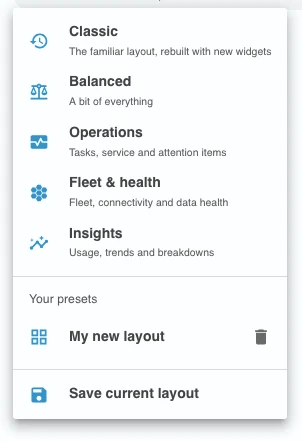
You never need to save the board itself: it saves automatically every time you leave edit mode. Saving a preset is something else. "Save current layout" in the presets menu stores a snapshot under a name of your choice, so you can experiment freely and always come back to a layout you liked. Your presets are stored with your company and can be applied or deleted from the same menu.
One board for admins, one for technicians
The Overview has two views: Admins and Technicians. Administrators switch between them with the tabs in the header and configure both. Technicians only see the technician board, so you can give them a focused page of tasks, map and calendar without the company-wide numbers. External administrators do the same for their external technicians: what they arrange on the Technicians tab is exactly what those technicians see. Each board saves on its own, and the small info icon next to the tabs explains the rules whenever you need a reminder.
Guests
Guest users get a fixed full-screen map of their installations with the installation and location counts. There is nothing to configure for them.
Maps: new markers, legends and an attention map
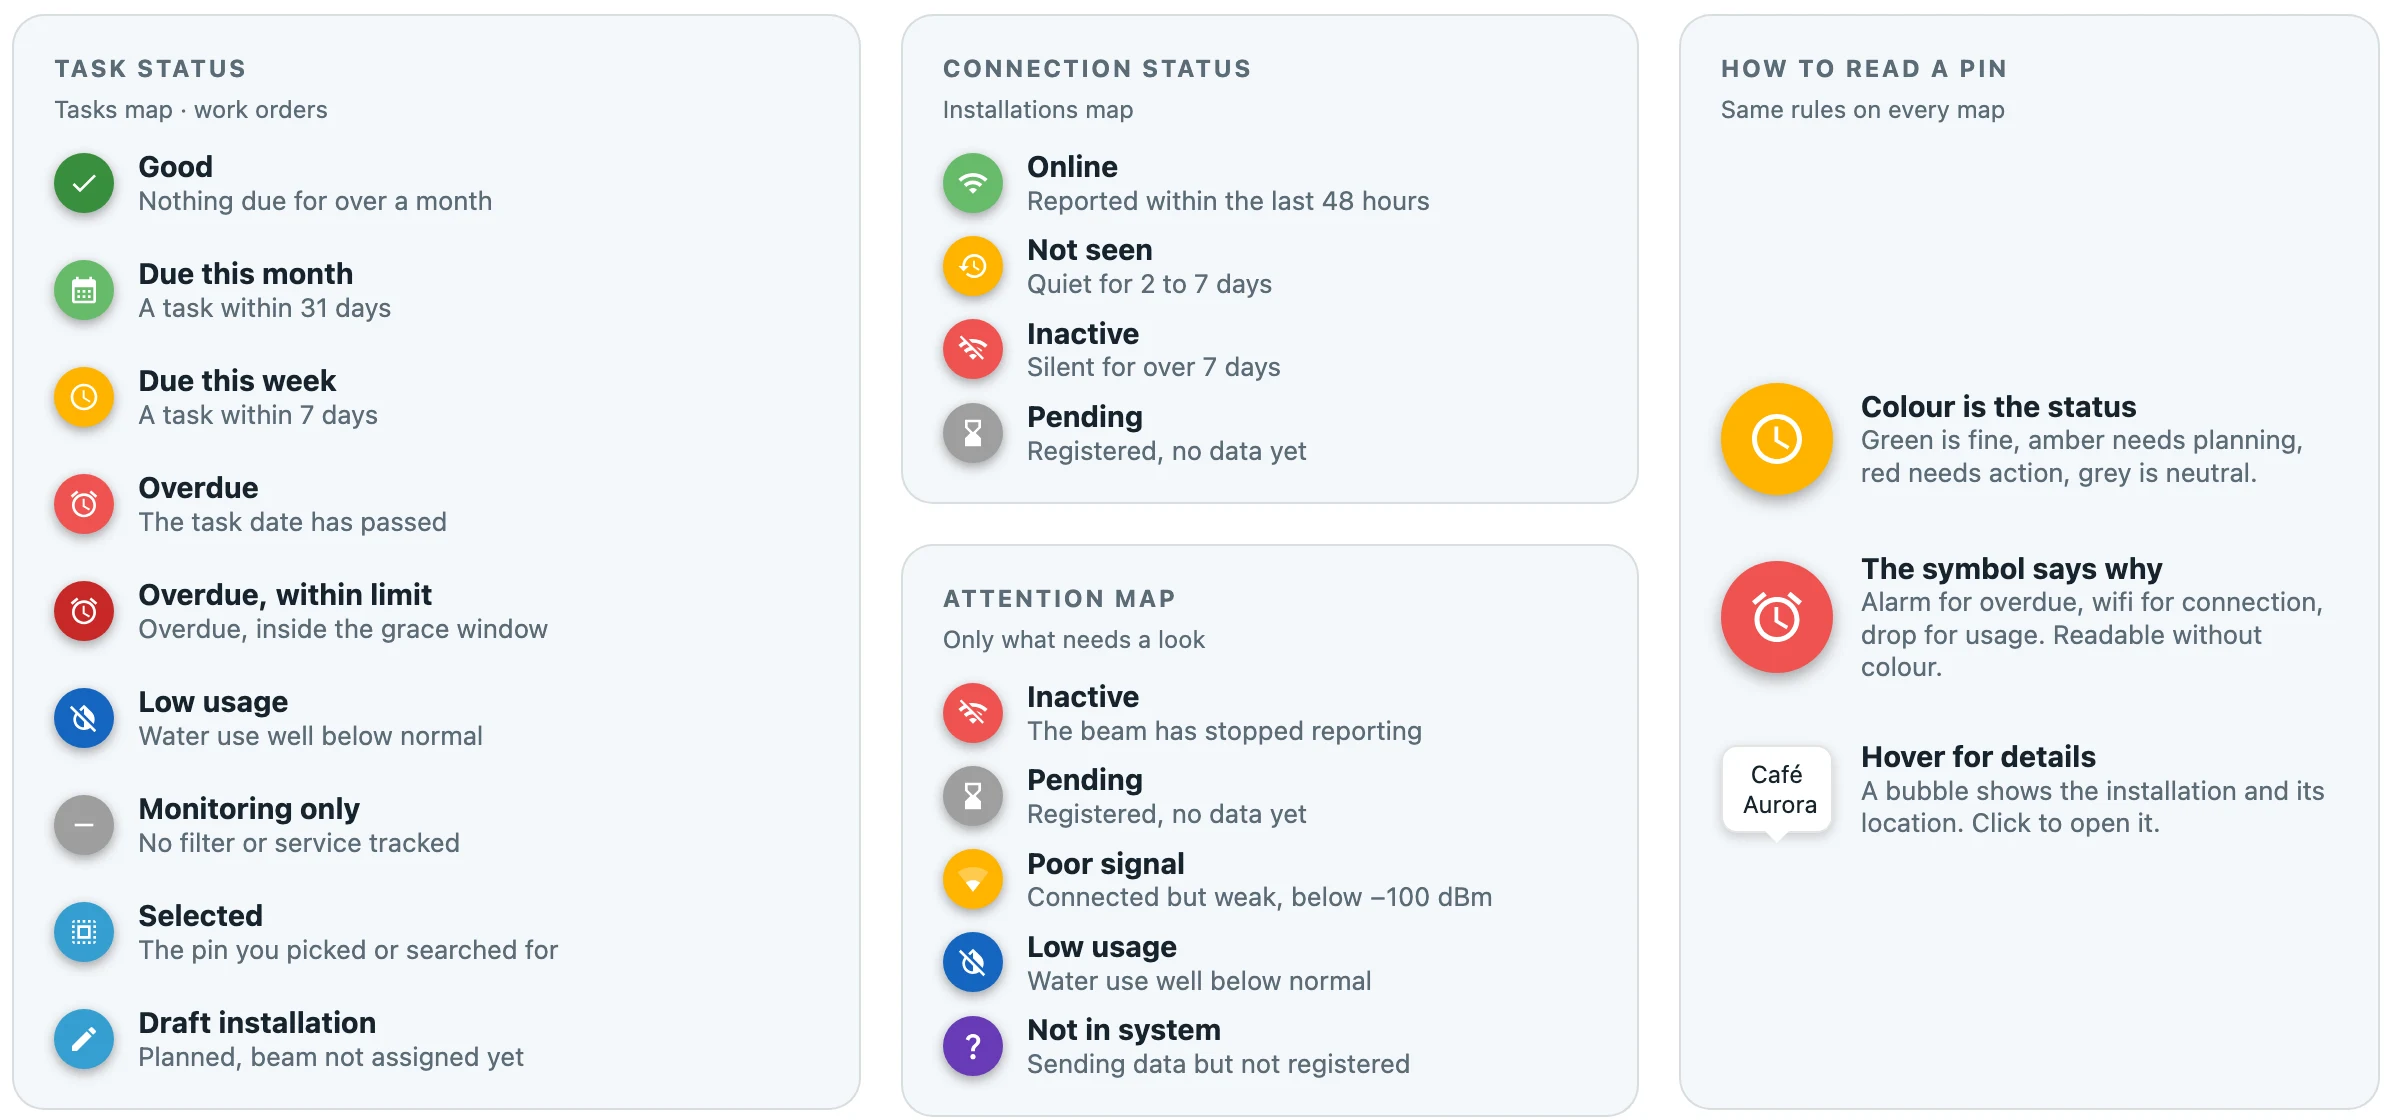
Every map in Backoffice, not only on the Overview, uses new marker icons. Each pin is a coloured badge with a symbol, so status is readable even for colour-blind users, and the colours follow light and dark mode.
Reading the markers
Task status pins: check mark for on track, calendar for due this month, clock for due this week, alarm for overdue, a slashed drop for low usage and a dash for monitoring only. Connection pins: wifi for online, history for not seen, wifi-off for inactive and an hourglass for pending. Drafts are pencils. A legend on each map explains the pins you are looking at.
The attention map
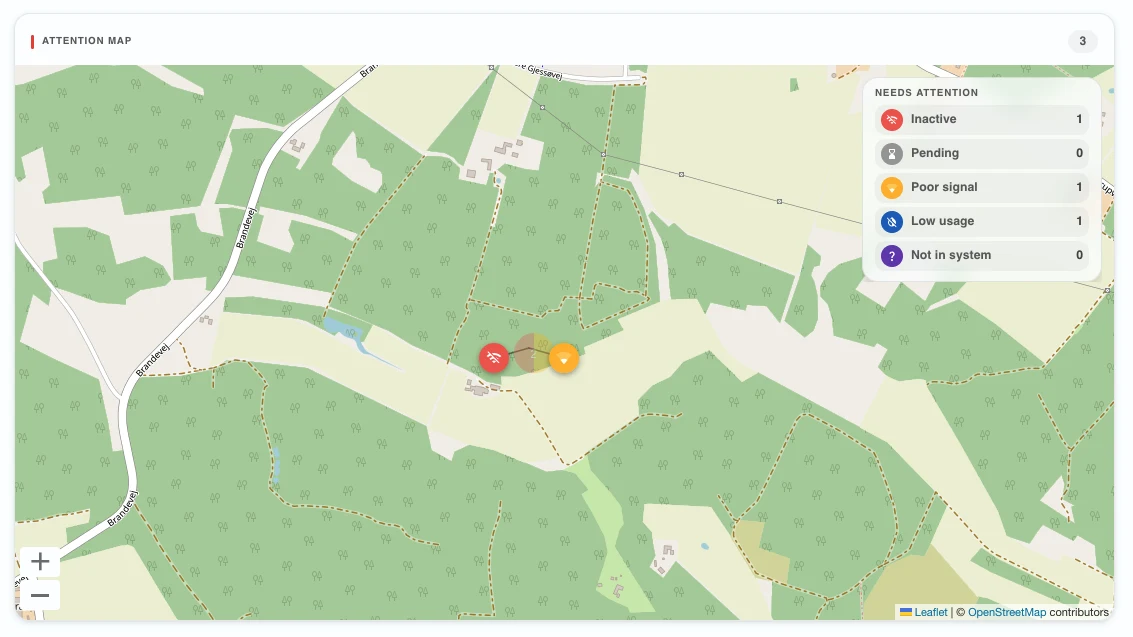
A new map widget shows only the installations that need a look: inactive, pending, poor signal, low usage and beams sending data that are not in the system yet. Toggle any category in the legend to focus on it.
Filters and search
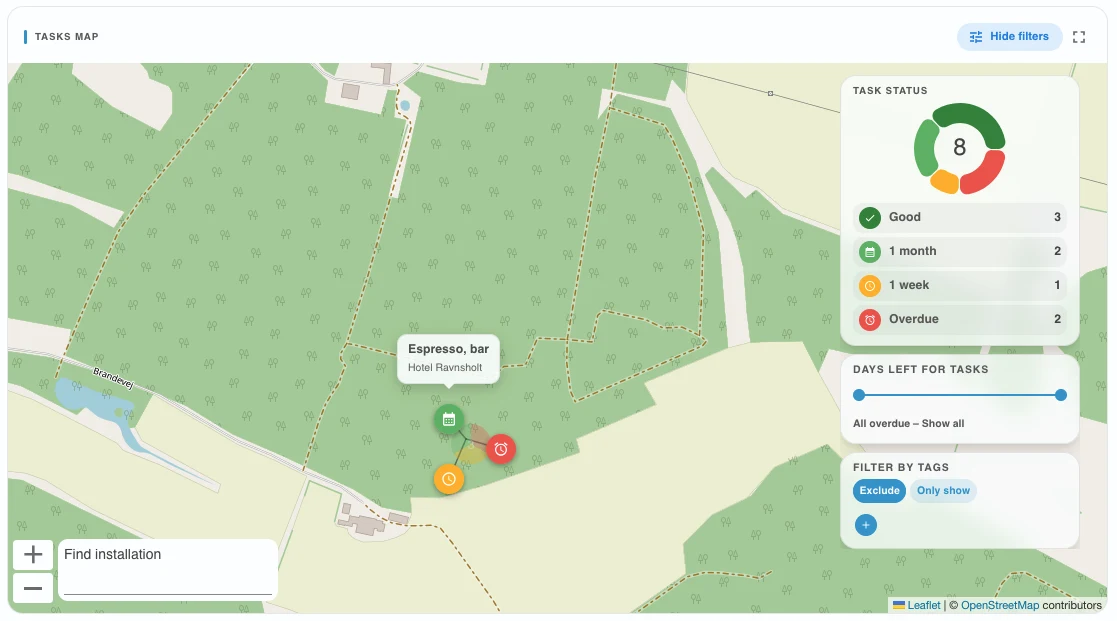
The tune button on a map widget opens the status donut and the days-left range you know from the old dashboard, and drafts can be toggled in the legend like any other pin. Tags are filtered for the whole page from the header, as described in the tag filter section. The search box finds an installation by name and centres the map on it. Clusters expand when you click them at the closest zoom.
Calendar, agenda and packing list
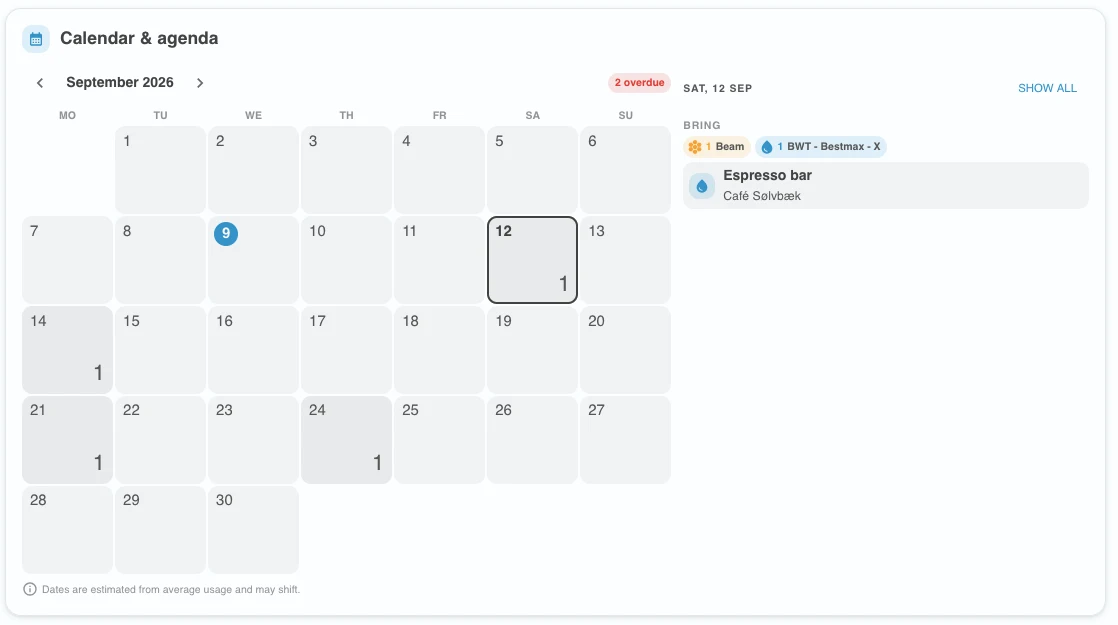
A calendar has been one of the most requested features for a long time, and here it is. The calendar widget shows the whole month, with small badges on each day for the filter changes, maintenance and battery changes due, a legend underneath and the month's total in the header. Days are shaded by how many tasks they hold, today is circled, and one click on a day lists its installations together with what to bring. The agenda widget lists the same tasks grouped by day, soonest first, so planning next week's route takes a glance instead of a spreadsheet.
Assign from the calendar
The calendar has a "view and assign tasks" button that opens the day's installations, ready to be sent to your technicians.
The packing list
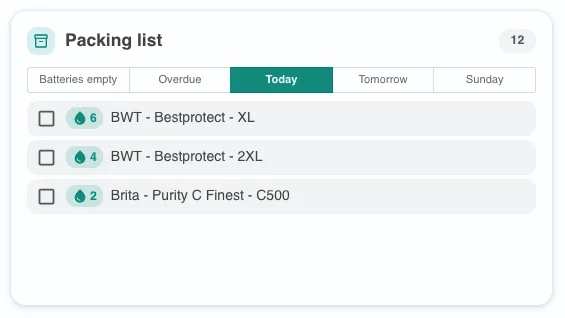
The packing list is a checklist for the next field trips, in five groups: empty batteries, overdue, today, tomorrow and the day after. Each group lists filters by type, batteries by type and the beams that need a look. Switch group in its header and tick items off as you pack them; the ticks are remembered for the day. Empty batteries and overdue tasks have their own groups so they never hide inside a normal day.
Where did it go?
Everything from the old dashboard still exists. Most of it became a widget, and the Classic preset puts the familiar ones back in their old places. Here is the map from old to new.
- On the old dashboard: The dashboard page at /waterfilterDashboard. Now: The Overview at the root address. Old bookmarks redirect.
- On the old dashboard: The installations map with status filters, tags, days-left slider and search. Now: The Tasks map and Installations map widgets. The days-left filter lives behind the tune button, search behind the magnifier, and the tag filter in the page header.
- On the old dashboard: The tag include and exclude filter on the map. Now: The tag filter chip in the Overview header, applied to the whole page at once.
- On the old dashboard: The task counters (7 and 30 days, filter changes, maintenance). Now: The Operations panel, or the individual Due this week, Due this month, Overdue, Water filters changed and Maintenance performed tiles.
- On the old dashboard: Installations and locations needing attention tables. Now: The Installations needing attention and Upcoming tasks widgets. "Show all" opens the full grid with export.
- On the old dashboard: Consumption status and connection status graphs. Now: The Task status and Connection status donut widgets.
- On the old dashboard: The location details dialog from the tables. Now: Click a row in the Upcoming tasks widget, or open it from the Installations and Locations pages as before.
Missing something?
Open the edit mode and search the widget drawer. If it is not there, let us know and we will look into it.
Tips to get started
- Start from the Classic preset if you want the old layout, then swap one widget at a time.
- Build the technician board around the map, the calendar and the packing list. That is what they open every morning.
- Put a title widget above each group of widgets to label the sections of your board.
- Works in dark mode too. Pins, donuts and legends all follow your theme.
- Put the board on a wall monitor: make the browser fullscreen and the menu and toolbar disappear, leaving only the widgets.
- Use the tag filter to turn the whole page into one region or one customer for a moment, then clear it with one click.